


Well, fuck. I didn’t expect all that.
You know what time it is: the tried-and-true Chronicles tradition of the post-election data breakdown. This time, though, is definitely different.
I’ll dissect the Dallas County results only for the Senate and Governor races. While the seats for Lieutenant Governor, Attorney General, Comptroller, Railroad Commissioner, Land Commissioner, and Agriculture Commissioner all flipped (and let’s not forget the State House, State Board of Education, and judicial seats!), exploring James Talarico’s and Gina Hinojosa’s colossal victories provides tons of insight.
TLDR
In Dallas County, Talarico and Hinojosa crushed it. I’m sure you’ve heard.
Communities that voted for Kamala Harris in 2024, as well as working-class communities with inconsistent voters, shifted even more to both candidates.
Structural problems remain, however, as those communities still lag behind the overall county turnout.
The solution? Read on to find out.
And as always, the AI explainer video:
Talarico’s win
Overall turnout
Let’s start with the voter turnout for our next U.S. Senator.
Dallas County saw 52.43% of its registered voters turn out for this race, which is huge for a midterm. By comparison, the 2022 midterm garnered only 44.23% overall.
Here are the top five communities that showed up at the polls:
Preston Hollow: 68.50%
Park Cities: 66.61%
Sunnyvale: 63.80%
Coppell: 62.14%
Richardson: 60.65%
And the bottom five:
Piedmont: 40.85%
Pleasant Grove: 40.24%
Kleberg-Rylie: 40.00%
East Oak Cliff: 39.45%
South Dallas: 36.67%
The Bellwether Award for Overall Turnout for Senator goes to Garland, which clocked in at 52.12%. Garland finally receives a shoutout in my Substack.
As usual, wealthier red communities show up in droves while working-class blue communities of color stay home. This has been an unfortunate theme in Dallas County that I’ve highlighted since my first post-election breakdown last November.
The notable exception is the middle-class community of Richardson, which finished #5 in overall turnout but voted 64.45% for Talarico. Good on my favorite Dallas suburb for turning out Democrats in such high numbers.
Talarico turnout
Now let’s proceed to who actually voted for our next junior Senator from Texas.
Talarico defeated Paxton in Dallas County with 71.72% of the share. Again, that’s an insane number. While the 2022 midterms didn’t have a Senate race, the closest comparison is the 2024 Senate battle between Colin Allred and Ted Cruz. There, Allred beat Cruz in Dallas County with 63.01%.
Here are the top five communities that helped carry Talarico to victory:
The Hills: 92.89%
East Oak Cliff: 92.80%
South Dallas: 90.45%
West Dallas: 88.70%
Lancaster & Glenn Heights: 88.61%
And the bottom five:
Rowlett: 56.81%
Sachse: 51.85%
Preston Hollow: 47.29%
Sunnyvale: 45.25%
Park Cities: 36.73%
The Bellwether Award for Talarico goes to Grand Prairie, with 71.89%. Grand Prairie, like Garland, finally receives a shoutout in my Substack.
But once again, working-class communities of color stay solidly in the Democratic column while wealthier white communities keep picking Republicans. It’s a sad but true reality of segregation in our county.
Hinojosa’s win
Overall turnout
Now let’s turn our attention to the voter turnout for the race that elected the first Latina for Governor of our great state.
Dallas County saw 52.40% of its registered voters turn out for this race, lagging behind the Senate race turnout by only 0.03%. That’s remarkably solid, to say the least, and it shows how voters continued down the ballot.
Here are the top five communities that marched to the polls:
Preston Hollow: 67.93%
Park Cities: 66.38%
Sunnyvale: 62.93%
Coppell: 61.19%
North Dallas: 59.56%
And the bottom five:
Piedmont: 40.06%
Pleasant Grove: 39.31%
Kleberg-Rylie: 39.07%
East Oak Cliff: 38.47%
South Dallas: 35.67%
The Bellwether Award for Overall Turnout for Governor again goes to Garland, with 51.16%. So Garland wins the Overall award for both races, proving that its residents, and Dallas County more generally, stayed consistently voting down the ballot.
Predictably, and at the risk of sounding like a broken record, more affluent white communities made their voices heard while less privileged communities of color did not.
Hinojosa turnout
Now let’s review which communities actually voted for our next Governor.
Hinojosa beat Abbott in Dallas County with 68.76%. By contrast, in 2022, Beto O’Rourke beat Abbott here with 62.73%. So Hinojosa outperformed O’Rourke by a healthy 6-point margin.
Here are her top five communities:
East Oak Cliff: 91.55%
The Hills: 91.08%
South Dallas: 88.91%
Piedmont: 87.28%
Lancaster & Glenn Heights: 87.01%
And the bottom five:
Rowlett: 54.48%
Sachse: 49.49%
Sunnyvale: 41.77%
Preston Hollow: 40.62%
Park Cities: 29.84%
The Bellwether Award for Hinojosa proudly goes to Mesquite, with 69.05%. Shoutout to Mesquite for finally making it to my Substack. (Grand Prairie came oh so close to racking up two awards today, with 69.80% of its registered voters choosing Hinojosa.)
And yet again, we witness communities of color offering unwavering support for the Democrat while wealthier and whiter communities back the Republican.
How much of a vibe shift was this election?
Next, I want to compare the political feeling in Dallas County now to that of November 2024. How much did the Overton window shift?
Support for Talarico in 2026 vs. Harris in 2024
To do this, let’s take Kamala Harris’ top five communities from November 2024. Then let’s see how those communities favored Talarico this year.
These are the communities and their support for the two Democrats:
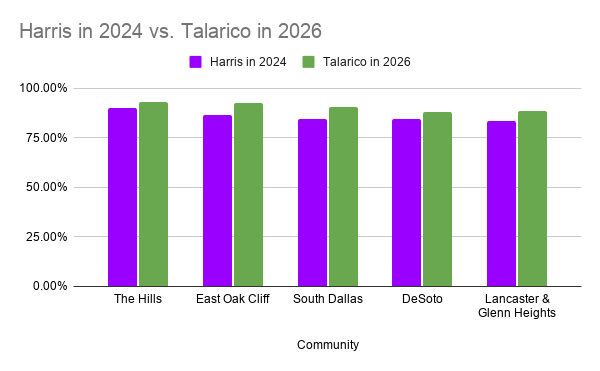
In every community, Talarico outperformed Harris. The largest difference occurred in East Oak Cliff, with a 6.32% margin. The average difference across these five communities was 4.71%.
Support for Hinojosa in 2026 vs. Harris in 2024
Next, let’s take those communities and analyze Hinojosa’s numbers:
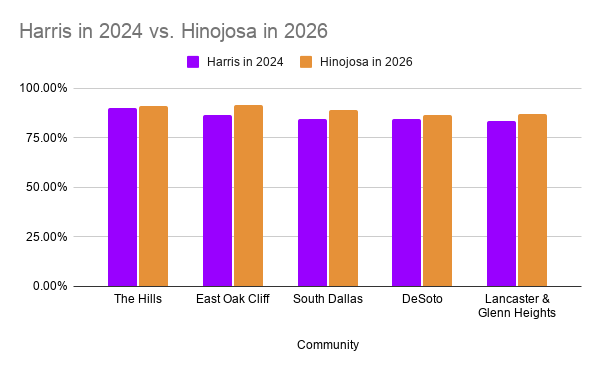
Much the same happened: Hinojosa outperformed Harris in each of the presidential candidate’s top five communities. East Oak Cliff again had the largest difference, at 5.07%. The average across the five communities was 3.16%.
So East Oak Cliff showed out! I’m going to credit Mathis Perkins for this one.
Which communities provided the most inconsistent voters for each candidate?
What about voters who regularly sit out elections unless they feel inspired? I call these people inconsistent voters; it’s less that they’re “independent,” swinging back and forth between parties, and more that they’re just tired of both sides. They compose a crucial part of the electorate.
Here are the top five communities with the biggest differences in support between Harris and Talarico:
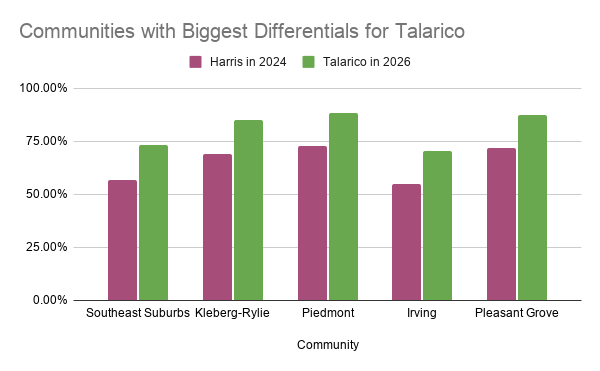
In this study, all five communities are generally working-class. The Southeast Suburbs, consisting of towns like Wilmer, Hutchins, and Seagoville, delivered the most new Democratic voters for the Senator-elect, with a difference of 16.32%. The average across the above communities was 15.86%.
For Hinojosa, the story is similar:
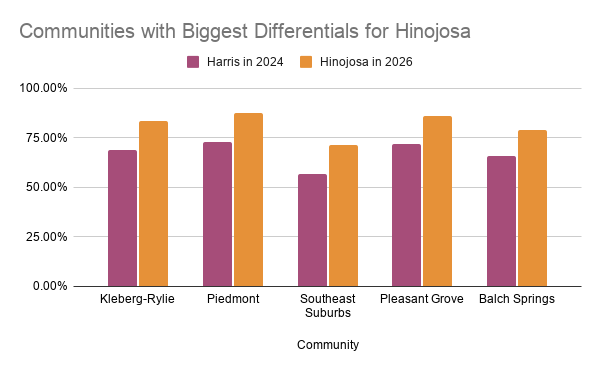
Kleberg-Rylie, despite having some of the lowest turnout rates for any election, furnished the Governor-elect with the most new Democratic voters, a difference of 14.72%. The average for this set was 14.04%.
So the lesson here is that working-class voters will make their voices heard if you give them an actual reason.
New bellwether communities
Finally, what if we want to better know where the average community stood in 2024 versus now?
In 2024, Harris received 61.31% of Dallas County’s vote to Donald Trump’s 38.69%. (Technically, she won 59.89%, but I didn’t account for the third-party candidates or write-in votes.) The bellwether community for her in 2024 was Lake Highlands, with 60.07%.
If we take Talarico’s 71.72% in 2026, the bellwether community in 2024 would’ve been Pleasant Grove, with 72.06%. Yep, Pleasant Grove. If you know, you know.
This reminds me of when South Dallas won the Bellwether Award for Amber Givens in her shock upset against incumbent John Creuzot in the District Attorney primary race in March 2026. Again, with South Dallas, if you know, you know. But I, for one, wouldn’t mind a taco stand on every street corner if the average of Dallas County for major elections was Pleasant Grove.
And if we take Hinojosa’s 68.76%, the bellwether in 2024 would’ve been the nearby community of Kleberg-Rylie. I’ll copy-paste my taco stand joke right here.
But what does this tell us? After this election, Democrats hold a remarkable opportunity to change the face of Dallas County. If you understand this city, going from an average of Northeast Dallas to Southeast Dallas in just two years represents a monumental political shift. Our county would bolster our blue majority and become possibly the biggest Democratic juggernaut in Texas. The real question, however, is, can we keep that energy?
Structural problems remain
Much has been made about whether Democrats won or Republicans lost. While I do believe that Republicans did everything imaginable these past two years to lose this midterm, and that inconsistent voters rallied mostly against them rather than for us, this issue somewhat misses the point.
Regardless of party, almost every challenger wins an election because of deep frustration with the status quo. Barack Obama swept into office in 2008 because of George W. Bush’s myriad of problems with the economy and foreign affairs. Two years later, Democrats got a “shellacking” in the midterms when Republicans gaslit the nation into thinking that Obamacare would “pull the plug on Grandma.” The takeaway is to capitalize on opportunities, no matter how we gain them.
But asking whether Democrats won or Republicans lost does expose structural complications our party continues to face, at least in urban counties like Dallas.
High-potential blue communities still stay home
The hard but true fact remains that our party’s most loyal base in Dallas County — working-class communities of color in the southern half — has a lot more room to grow. This election brings that even more to light.
Turnout in Talarico communities vs. county turnout: Let’s begin by inspecting the top five Talarico communities and comparing each’s overall turnout against the county turnout. This is similar to when we queried where in Dallas County the Democratic Party should focus.
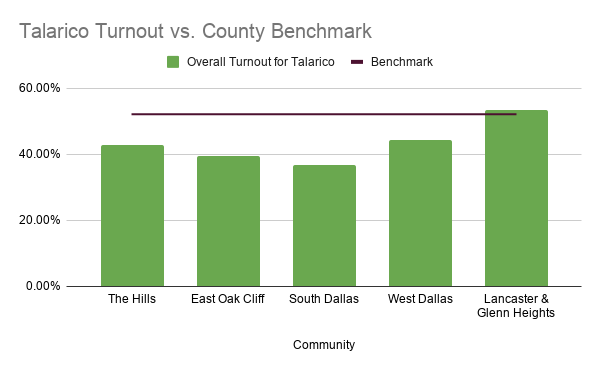
We notice that four out of his five best-performing communities fall drastically short of the county’s benchmark. Lancaster barely survives, outperforming the county by only 1.18%. The average across the five communities is 8.79% below the county standard for this race.
Turnout in Hinojosa communities vs. county turnout: Inquiring about Hinojosa’s communities offers no solace either.
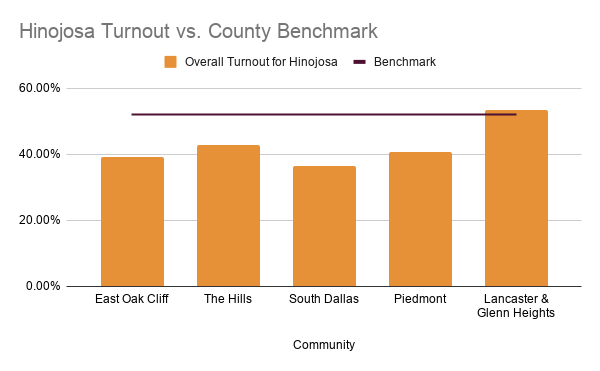
As with Talarico, East Oak Cliff, The Hills, and South Dallas all underperform, while Lancaster ekes past the county. The average for these five communities is 9.56% below the benchmark.
Turnout in Paxton communities vs. county turnout: Now, what if we look at the Republican side? Do they experience better results?
Here are Paxton’s top five communities compared against the county turnout:
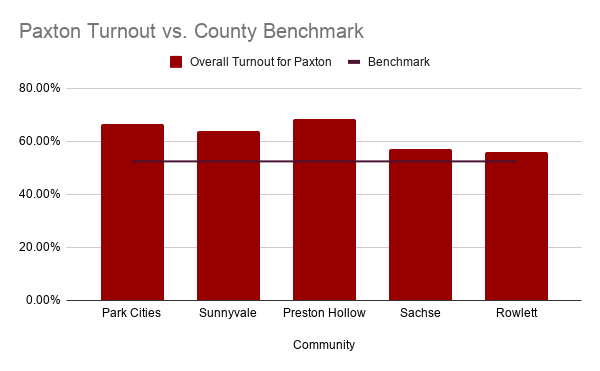
Every single one of his communities outperformed the county, with an average of 10.00% above the benchmark.
Turnout in Abbott communities vs. county turnout: The same holds true for Abbott, with an average of 10.21% overperformance.
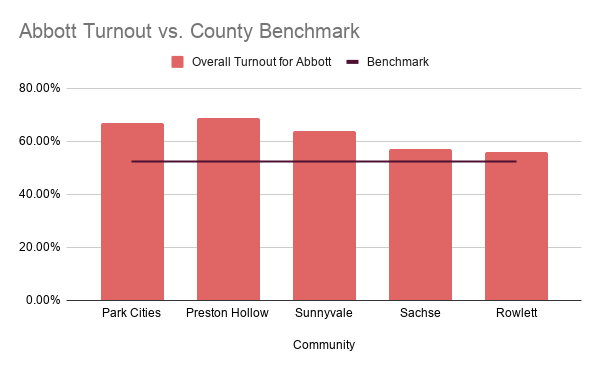
Working-class communities of color need help: The problem is clear: blue strongholds, mostly working-class communities of color, don’t turn out enough voters.
As I keep illustrating throughout my Substack, the overriding factor keeping these voters home is economic. These citizens deal with too much cognitive overload — paying bills, putting food on the table, breathing clean air, drinking clean water, finding reliable transportation — to research who to support in an election. That is why we need to tackle our party’s political problem of high-potential blue communities staying home by first tackling a more fundamental civic problem.
But first, let’s examine how we managed to finally convince voters to give us such a clear mandate for change.
Why Democrats actually won this time around
Democratic candidates succeeded this election cycle for two reasons:
Republicans really shit the bed this time
Democrats finally decided to stand for something as opposed to only standing against something
I focus almost exclusively on our side. While Republicans cleared the way for a Democratic rout, I don’t really care what they do. Our party must constantly focus on what we bring to the table.
And we did this time. Because of glaringly obvious economic realities like inflation, stagnant wages, and high gas prices, Democrats more easily crafted a clear and simple economic message: affordability. It’s the 2026 version of Bill Clinton’s “It’s the economy, stupid” from 1992, but with added components like a lack of reasonably priced housing.
“Affordability” should’ve been the message all along, and it made inconsistent working-class voters feel safe enough to offset a blue tsunami across the nation. Otherwise, 2026 would’ve felt a lot like 2024. In this election cycle, we focused more on inconsistent working-class voters and less on how amazing we are or how terrible the other side is.
But when all the votes have been cast and all the high-soaring speeches have been delivered, what then?
The solution: Civically engage inconsistent voters
This is the hill I’ve decided to die on: To build long-term Democratic infrastructure, don’t talk about Democrats.
We won this election by employing that strategy, and we can sustain our newfound working-class majority with exactly that strategy. The question then becomes: How do we build that infrastructure?
How the Republican Party built a juggernaut
At the moment, Democratic politicians and strategists are eagerly telling everyone that our newly elected Democrats must deliver on the promises they made during their campaigns. While it’s critical that our officials realize that the people have granted them permission to take decisive action, this method of waiting on politicians who run for re-election every two, four, or six years proves risky.
Assuming good faith on the part of our new Democratic leaders (which itself can also be dangerous), it leaves a yawning gap of at least two years for Republicans to exploit. Remember earlier when I mentioned the Republican gaslighting in the 2010 midterms? They took back control not because Democrats necessarily did a bad job governing, but because our party never bothered to embed itself at the local level the way Republicans did.
Because that same year, the Republican Party devised a scheme for long-term control. Project REDMAP served as the blueprint for the takeovers of state legislatures, legislative benches, and school boards. It was the 2010 version of Project 2025, but with more of a cultural chokehold because of its effective grassroots organizing. The Democratic Party, honestly, has been reeling ever since.
The response, in my view, is not just to mimic the Republican Party’s strategy of gerrymandering districts and running candidates. The main flaw in that approach is that it’s still driven primarily by ephemeral campaigns that abruptly leave communities once the election cycle concludes. The Democratic Party needs a more permanent, year-round organizing philosophy. That philosophy involves a fundamental overhaul of how Americans view civics.
To ensure we keep voters civically engaged, however, we must ask three important questions:
How do we civically engage people?
What is the clear benchmark for civic engagement?
Who will be held responsible for this civic engagement?
How do we civically engage people?
To answer this initial question, we must first accept that most Americans, especially the working-class, don’t wish to discuss politics. This is especially true for strangers at their doorsteps who wonder if they’ll support some candidate in an election they didn’t realize existed.
Instead, we should operate with the simple mindset of solving their problems. If we can remove one problem from this person’s life right now, what would it be? Do they need a job, or a better job? Do they need to figure out their healthcare? Do they have problems keeping up with rent or the mortgage? Even if we can’t immediately solve their one pressing issue, listening goes a long way. That’s how candidates win elections — by meeting people where they are and understanding their struggles.
Meeting them where they are constitutes a significant piece of this strategy and is how we formalize the mechanics of engagement. I’ve written that the biggest and lowest-hanging fruit for urban counties like Dallas is organizing renters. Instead of showing up at their doorsteps to tell them about politics, we show up to listen to their needs.
What is the clear benchmark for civic engagement?
After we listen and understand, what do we do with that information? How do we start solving their everyday problems? We do that by ensuring they vote in the elections that matter most to their everyday problems: local elections.
In local politics, there exists a U-shaped curve of civic engagement. The political extremes, occupied by progressive and conservative politicos, dominate civic discourse. In areas like housing, transit, public safety, environment, and, ultimately, voting, obsessive Democrats and Republicans, whether knowingly or not, crowd out the voices of people whose lives are actually affected by these niche policy decisions. But rather than partaking in local matters, these inconsistent working-class voters, burdened by a lack of cognitive bandwidth, sit it out.
So the goal becomes to transform this U-shaped curve into a plateau. For every local election, our key performance indicator must be to increase the number of voters who previously had not voted in local elections. This goes beyond merely urging them to choose this candidate or that issue, as I know we politicos are apt to do. The larger structural issue is that they don’t care enough to vote at all. Once we properly address that concern, we are free to discuss who or what to vote for.
Who will be held responsible for this civic engagement?
And finally, we need to settle the question of who will handle all this. The easy answer is the Democratic Party. But the real answer is your local Democratic Party.
The party has long suffered from what Caroline Welles describes as a pyramid-shaped campaign economy: “[M]oney and authority at the top, relationships at the bottom. The people furthest from voters control the most resources, while the people closest to voters are expected to operate on fumes.” To fix this, she argues, we must invert this pyramid.
Following the 2016 presidential election, establishment institutions like the Democratic Legislative Campaign Committee ramped up resources for statewide campaigns and ballot initiatives. While this method is not inherently wrong, it does little to help invert that pyramid. Who’s to say which candidates and initiatives I should vote for? And how do you know if those candidates or initiatives will aim to fix my problems in the first place?
What we need to do has been staring us in the face this whole time: The Democratic Party must strengthen its existing infrastructure that it often neglects in favor of ephemeral campaigns.
Many state and local parties operate with little budget or means to hire proper year-round staff. Local parties, especially, the entities directly on the ground, need trained organizers to canvass communities, listen to people, and collect grassroots data to feed to the national Democratic Party. If we do nothing else for local parties, this would suffice for a decent barebones operation. Your local Democratic Party is the one most ready to be there for you.
Conclusion
Ultimately, we need a genuine grassroots strategy to revitalize the Democratic Party. What Republicans have long done has been smart and effective, but their strategy of running candidates for school boards and gerrymandering districts leaves an opening we can take advantage of: it’s still not grassroots enough. Telling people who to vote for is less appealing than actively listening to them and hearing what they want. If we really are the Big Tent Party, as 2026 has proven, we should back it up with action.
And only then does the Democratic Party become a true juggernaut.