
November 2025 Election Results in Dallas County: What Did We Actually Learn?
A statistical analysis into each proposition in Dallas County, and where we can go from here

Source: Dallas County Elections Department
Now that this year’s constitutional amendment election is over, let’s take a look at how Dallas County performed and what we can glean from the results.
TLDR: Based on the data, Texas is still fundamentally a conservative state, and it’ll take us a while to change that. As far as Dallas County is concerned, we need to focus more on turning out likely Democrats in communities of color. That also probably applies to urban counties in general.
Voter turnout
First and foremost, many more people voted in this election than in the November 2023 election. In November 2023, 11.96% of registered voters in Dallas County visited the polls. This year, 16.31% of registered voters cast their ballots. A big win! Of course, voter turnout is usually better in a year after a presidential election than in a year after a midterm. But this year especially, with No Kings protests, Texas Democrats leaving the state because of Republican gerrymandering, California Democrats passing their own version of gerrymandering, and just Trump in general, people felt more motivated to vote.
Senate District 9
Although not in Dallas County, the race for Senate District 9 in neighboring Tarrant County delivered the biggest sign of hope for Texas Democrats. Taylor Rehmet finished first in a three-candidate field, receiving 47.6% of the vote in a historically Republican district, and will be heading into a runoff with MAGA darling Leigh Wambsganss, who garnered 36% of the vote.
We can credit Rehmet’s strong performance to his inspiring story, sticking to issues that actually matter to people, and the grassroots organizing that has taken place in that district. At least some of that organizing can be connected to the work by the 817 Gather community. This Tarrant County group of progressives does not explicitly associate with the Democratic Party, concentrating instead on local issues and giving activists actionable items each week on its podcast and each month in their in-person meetings. The Democratic Party needs to take some cues from them, which is something we’ll briefly mention again later.
Outside of Senate District 9, however, the picture is less clear. While voter turnout far exceeded that of two years ago, the results fundamentally remained the same. I won’t go into each local race in Dallas County, as that would take far too long and candidates facing each other in nonpartisan races sometimes represent the same party. I’ll instead discuss the voting results of the 17 propositions and what that might tell us about the future.
Texans at large still voted conservative
First, let’s acknowledge that Texas voters passed all 17 propositions. That includes the bad ones, like Proposition 12, which allows Governor Greg Abbott to appoint a majority of the independent commission that disciplines judges, the ones he condemns as “activist judges.” We Texas Democrats simply cannot brush this off. Over the past week, I’ve witnessed Texas political insiders and casual liberals alike pivot to Zohran Mamdani becoming New York City’s next mayor or the possibility that Gavin Newsom will be our next presidential candidate. Frankly, for now, I don’t care. Despite two massively successful No Kings protests, countless visibility protests, and general anger directed at Trump and the Republican Party, Texans decided to grant more power to state Republican politicians.
You may believe that voters may not have read or were confused by the wording of the propositions. I confess that I thought that as well, posting on social media the day after the election that “vibe voting,” the act of going to the voting center without a clear idea of the contents on the ballot and relying on feeling and energy, contributed to the passing of all 17 propositions. How can all this insanity be happening and people are still giving Abbott more power? I wondered. Once I crunched the data for Dallas County, however, another narrative, one that had little to do with vibe voting, arose.
Turnout for Dallas County
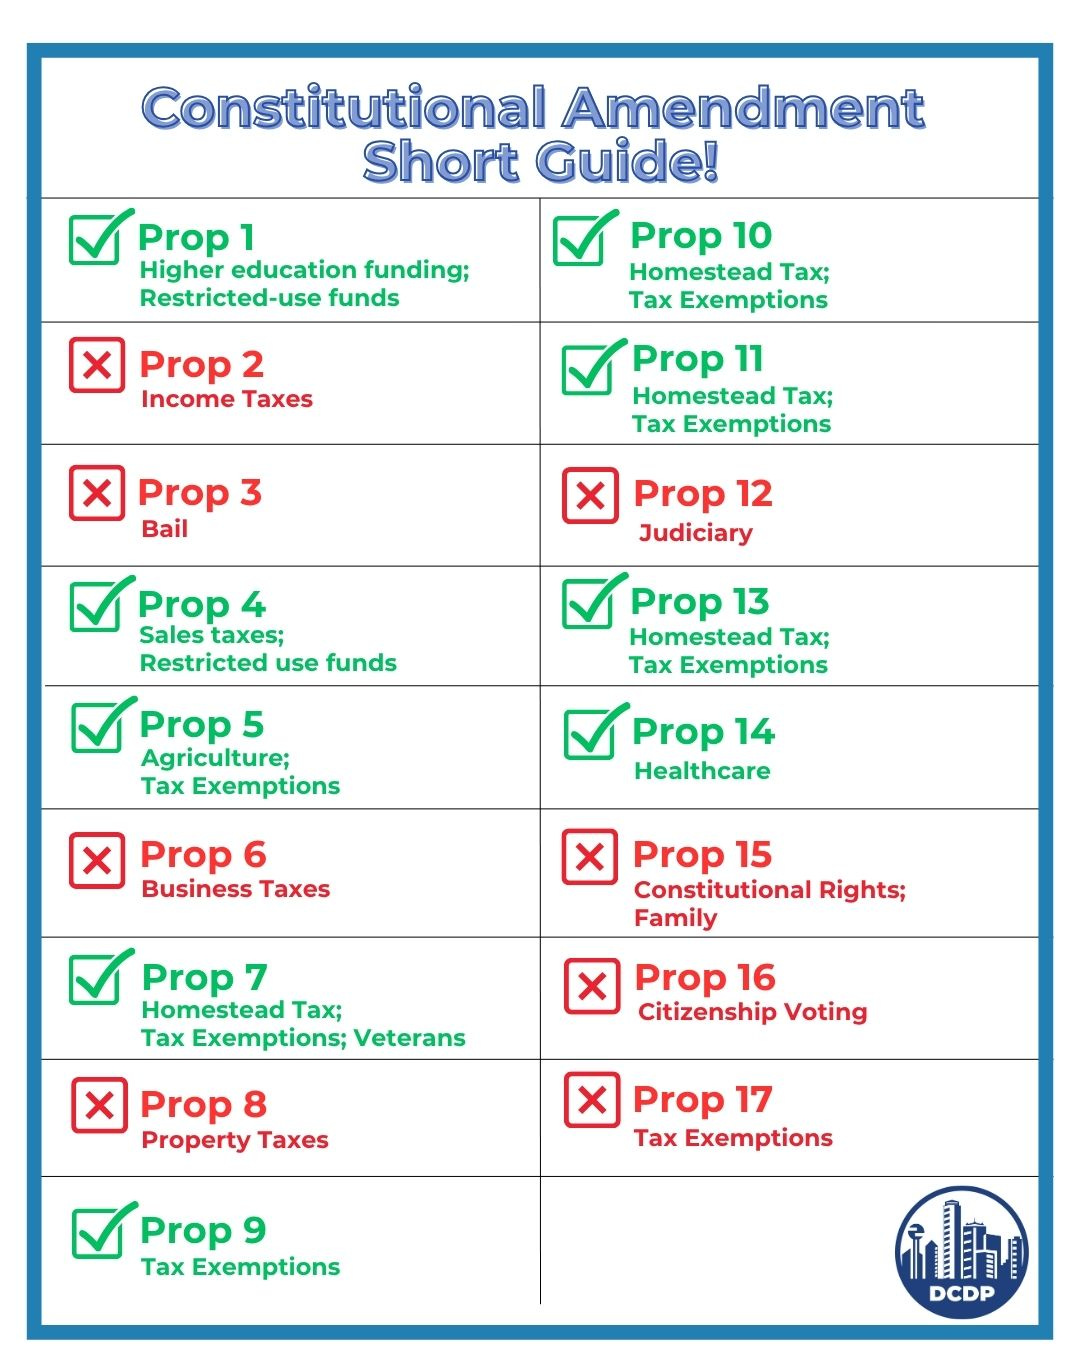
We’ll examine that data by first looking up the recommendations made by the Dallas County Democratic Party (DCDP). Here’s their short guide:
Next, we’ll inspect how turnout fared across Dallas County and list the top five communities where voters made their voices heard. I use my own breakdown of communities that I mentioned in a previous post.
Coming in at the top five are…
Sunnyvale: 29.24%
Richardson: 25.74%
DeSoto: 21.72%
Far North Dallas: 21.51%
Sachse: 20.75%
Congratulations to Sunnyvale! You guys are always overlooked. Richardson, DeSoto, Far North Dallas, and Sachse round out that list.
And the bottom five belongs to…
South Dallas Area: 10.10%
Balch Springs: 8.85%
Piedmont Area: 8.82%
Kleberg-Rylie: 8.38%
Pleasant Grove: 8.27%
What’s the big difference between these two groups of communities? Money. As I’ve stated before, people with more income tend to have more time to think about voting. We’ll touch on this again later in this post.
How did each proposition do throughout Dallas County?
Because I love this stuff, and because I know you love it too, here is how each proposition did. First, let’s take a look at each proposition’s performance throughout the entire county. The percentage represents the percentage of people who voted for the proposition. We’ll also keep in mind how DCDP recommended each proposition.
Proposition 1 (DCDP recommends FOR): 76.55%
Proposition 2 (DCDP recommends AGAINST): 54.38%
Proposition 3 (DCDP recommends AGAINST): 47.74%
Proposition 4 (DCDP recommends FOR): 74.87%
Proposition 5 (DCDP recommends FOR): 56.88%
Proposition 6 (DCDP recommends AGAINST): 45.01%
Proposition 7 (DCDP recommends FOR): 84.88%
Proposition 8 (DCDP recommends AGAINST): 64.16%
Proposition 9 (DCDP recommends FOR): 62.00%
Proposition 10 (DCDP recommends FOR): 85.69%
Proposition 11 (DCDP recommends FOR): 74.85%
Proposition 12 (DCDP recommends AGAINST): 49.49%
Proposition 13 (DCDP recommends FOR): 76.63%
Proposition 14 (DCDP recommends FOR): 73.45%
Proposition 15 (DCDP recommends AGAINST): 60.14%
Proposition 16 (DCDP recommends AGAINST): 60.27%
Proposition 17 (DCDP recommends AGAINST): 44.80%
Next, let’s break it down to the community level. Here are the top five communities that voted for each proposition.
Proposition 1 (DCDP recommends FOR)
The Hills: 84.96%
DeSoto: 83.98%
Lancaster & Glenn Heights: 83.97%
East Oak Cliff: 83.78%
Southwest Dallas: 82.78%
Proposition 2 (DCDP recommends AGAINST)
Park Cities: 81.97%
Sunnyvale: 80.31%
Sachse: 72.89%
Rowlett: 67.40%
Preston Hollow: 66.31%
Proposition 3 (DCDP recommends AGAINST)
Sunnyvale: 71.71%
Sachse: 65.16%
Park Cities: 64.63%
Rowlett: 59.70%
Garland: 58.52%
Proposition 4 (DCDP recommends FOR)
East Dallas: 78.77%
Lake Highlands: 78.63%
Sachse: 77.53%
Downtown Area: 77.45%
Richardson: 77.35%
Proposition 5 (DCDP recommends FOR)
Park Cities: 77.20%
Sunnyvale: 72.38%
Sachse: 69.53%
Preston Hollow: 65.88%
Richardson: 64.28%
Proposition 6 (DCDP recommends AGAINST)
Park Cities: 73.26%
Sunnyvale: 69.36%
Sachse: 61.92%
Preston Hollow: 56.97%
Rowlett: 55.29%
Proposition 7 (DCDP recommends FOR)
Sachse: 90.00%
Sunnyvale: 89.66%
Rowlett: 88.67%
DeSoto: 88.21%
Cedar Hill: 87.51%
Proposition 8 (DCDP recommends AGAINST)
Sunnyvale: 86.33%
Park Cities: 83.44%
Sachse: 80.58%
Rowlett: 75.76%
Garland: 71.04%
Proposition 9 (DCDP recommends FOR)
Park Cities: 78.99%
Sunnyvale: 77.59%:
Sachse: 73.65%
Preston Hollow: 68.16%
Rowlett: 67.71%
Proposition 10 (DCDP recommends FOR)
Sachse: 92.09%
Sunnyvale: 91.98%
Rowlett: 89.96%
Cedar Hill: 88.78%
DeSoto: 88.19%
Proposition 11 (DCDP recommends FOR)
Sachse: 82.81%
Sunnyvale: 82.62%
Rowlett: 81.14%
DeSoto: 78.99%
Cedar Hill: 77.80%
Proposition 12 (DCDP recommends AGAINST)
Sunnyvale: 74.49%
Sachse: 68.35%
Park Cities: 64.61%
Rowlett: 64.20%
Garland: 61.97%
Proposition 13 (DCDP recommends FOR)
Park Cities: 88.50%
Sachse: 86.47%
Sunnyvale: 85.65%
Rowlett: 84.10%
Preston Hollow: 82.85%
Proposition 14 (DCDP recommends FOR)
Garland: 76.06%
DeSoto: 75.98%
North & West Oak Cliff: 75.94%
The Hills: 75.84%
Buckner Terrace Area: 75.70%
Proposition 15 (DCDP recommends AGAINST)
Sunnyvale: 83.36%
Park Cities: 76.36%
Sachse: 75.90%
Rowlett: 73.69%
Southeast Suburbs: 70.95%
Proposition 16 (DCDP recommends AGAINST)
Sunnyvale: 85.56%
Park Cities: 80.97%
Sachse: 77.13%
Rowlett: 73.06%
Mesquite: 69.81%
Proposition 17 (DCDP recommends AGAINST)
Park Cities: 71.91%
Sunnyvale: 70.85%
Sachse: 61.91%
Rowlett: 56.15%
Preston Hollow: 54.11%
If you’ve bothered to make it this far and you’re familiar with Dallas County, you’ll notice a pattern: In general, more left-leaning communities voted with DCDP’s recommendations, and more right-leaning communities voted against.
But how do we know for sure that certain communities tend to vote Democratic while others vote Republican? Shouldn’t we have data for that as opposed to relying on vibes?
Well, I’m glad you asked! The best way to suss out a community’s political leanings is by looking at how they voted in the most recent presidential election.
Here are the top five communities that voted for Kamala Harris in November 2024.
The Hills: 90.04%
East Oak Cliff: 86.48%
South Dallas Area: 84.65%
DeSoto: 84.59%
Lancaster & Glenn Heights: 83.44%
And here are the bottom five.
Coppell & Lewisville: 50.51%
Rowlett: 45.86%
Sachse: 40.43%
Park Cities: 32.64%
Sunnyvale: 32.52%
Notice a trend between these two lists and the 17 previous lists?
The Hills (comprised of Highland Hills and Singing Hills), East Oak Cliff, and DeSoto, among others, remain consistent Democratic bastions that the party must rely on. Conservative communities on the other hand, like Sunnyvale, Park Cities, and Sachse, tended to vote against DCDP’s recommendations and also voted for Trump.
Dispelling a myth about voting habits in this election
Before we move on, I want to address a claim that some Democrats, including myself, make: People go to the polls and don’t really know what they’re voting on. While this may be true for bigger elections, when infrequent voters stroll to the polls knowing who they want as president but have no clue which municipal bond to support, it actually may not ring true for smaller elections.
If you vote in an odd-year election, chances are that you’ve done your research. We can see that this cycle. DCDP made some recommendations that many progressives, including other county Democratic parties, disagreed with. Proposition 5 (tax exemption on animal feed) and Proposition 9 (inventory and equipment tax exemption) are two such examples. For those, the staunchly conservative strongholds of Park Cities, Sunnyvale, Sachse, and Preston Hollow all agreed with the county party.
But that also means that people, for the most part, put more effort into voting than we may give them credit for. If people truly did vibe vote, the results in this election would not have proven nearly as consistent. That also means, unfortunately, that all the conservative propositions passed not because of clueless voters, but because of conservative voters.
Yes, Democrats across Texas are feeling good right now. Yes, we love our protests and gatherings. But allow me to be your resident Debbie Downer: Texas Democrats haven’t yet won an outright victory. I would venture to guess that most of the reason we feel so high is because Democrats across the nation scored huge victories: New York, California, and Virginia, namely.
And even though Texas voters turned out in record numbers, outside of Senate District 9, we haven’t seen anything tangible in our state that should lead us to believe that we’ll be flipping it blue anytime soon. Democratic voter turnout increases, but so does Republican voter turnout.
Now, if more state-level races, like the one for Senate District 9, were on the ballot alongside those 17 propositions, would we have seen different results? Would exciting and energetic Democratic candidates who rile up the base have prompted more progressives to vote? Perhaps. But that’s all the more reason that we should dig in to our base now and focus on one thing that we’ve learned studying this data, at least in Dallas County: Focus on communities of color.
Democratic alignment
I’m tired of repeating it: Democrats need to focus on communities of color, especially disadvantaged neighborhoods. This holds especially true for urban counties like Dallas. But it also resonates for rural Hispanic counties, like those in the Rio Grande Valley, as Esme Zuniga, former Communications Director for the Hidalgo County Democratic Party, explained on my last podcast episode.
But since I live in Dallas, I’ll stick to Dallas. As we dive a little more into this election’s results, we find something rather unsettling for the Democratic Party: communities with huge Democratic potential that display low voter turnout.
I wondered, just based on this election, which communities align most with the Democratic mission and which do not. This is actually something that stemmed from a much larger data effort I completed soon after the November 2024 election. More on that in later posts.
But for this cycle, I put together a calculation that factored Democratic turnout from November 2024 and alignment with DCDP on this year’s propositions. That way, we can see which communities are the most ready for progressive organizing in 2026. (I realize that DCDP made some peculiar proposition recommendations this year, but apparently voters recognized that as well, since they didn’t take to heart the county party’s recommendations.)
Overall, Dallas County itself averaged 0.40 on this score. Northwest Dallas, a community with a diverse population of whites, blacks, and immigrants, also scored 0.40. The interesting thing about Northwest Dallas is that both it and the county posted eerily similar turnout results: Northwest Dallas turned out 16.35% of its registered voters and Dallas County turned out 16.31% of its registered voters. So if we want to know how Dallas County is doing, we should look no further than Northwest Dallas.
As far as communities ripe for more intentional progressive organizing, what do we find? Here is the list ranked in descending order of total alignment with the Democratic Party.
The Hills: 0.58
East Oak Cliff: 0.57
DeSoto: 0.55
South Dallas Area: 0.55
Lancaster & Glenn Heights: 0.53
Are you picking up on it? Many of the same familiar names keep appearing. The Hills, East Oak Cliff, and South Dallas are all largely black communities that vote solidly blue, but whose voter turnout lags behind the rest of the county. DeSoto and Lancaster are largely black communities that also vote blue but that regularly show up at the polls.
Where we can go from here
What does this tell us? Two things. First, black people in Dallas County (and in urban counties at large) make up the base of the Democratic Party.
Second, the Democratic Party needs to devise a more proper organizing strategy. To me, the organizing should really be broken down into two prongs: long-term grassroots outreach and short-term campaigning. Communities like The Hills, East Oak Cliff, and South Dallas, where economic disinvestment has reigned for far too long, can benefit from the former. DeSoto and Lancaster, on the other hand, probably need to be only reminded of who’s running for what races and what municipal bonds to vote on.
That is not to say that the two prongs are mutually exclusive. In the end, all of our organizing is done so that more progressive candidates take office and do the work for the people. But in communities where people feel detached from the broader political system, mostly because of lack of economic opportunities, we need to actually listen to their concerns and propose new and progressive solutions.
Yes, progressive, but the operative word here is new. I fear that’s something the Democratic Party might not budge on. People who constantly worry about how to pay rent or put food on the table don’t care about party insiders yelling at them to vote Democratic. They need to fulfill the bottom levels of Maslow’s hierarchy of needs — food, shelter, safety — before they can decide who to support in a primary. That is why reaching out to grassroots organizations and organizers, ones who don’t necessarily associate with the Democratic Party or even progressives, should make up a crucial part of the party’s outreach strategy.
In Dallas County, for example, as is the case with other urban counties, affordable housing is in short supply. A myriad of nonprofits and influencers in this space have been tackling the issue, but only a scant number of well-known Democratic politicians, at least in Texas, include it in their rallying cries.
Multimodal forms of transportation — walking, biking, trolleys, buses, and trains — should be the no-brainer default option for how we move around town. More cars, roads, and highways induce more sprawl and make it more difficult for economically disadvantaged people, many of whom are black and brown, to go to work and carry out simple errands. Grassroots organizations have been shouldering this cause, assembling their supporters to speak at city halls and canvass people at train stations, but hardly any Democratic politician at the local level has served as the face of saving public transportation.
Racist environmental impact from outdated factories built in more recently zoned black and brown neighborhoods affects black and brown people more than white people. There is no other way of saying that. Organizers have for decades known this and have fought against it, but without that one strong Democratic voice in office advancing environmental justice, fewer people pay attention.
The solution to these problems is not just to simply search for candidates to run for office who promise that they’ll work on these issues. The way to address them is to have strong local Democratic parties that become the thought leaders on these topics and act as the intermediary between the politicians, Republican and Democratic politicians alike, and the people. This is much like how the 817 Gather community has done it in Tarrant County.
Will we see change right away? No. This is not going to be an overnight success. But hardly anything truly successful and long-lasting happened quickly. This is going to take years of hard and intentional work, reaching out to communities and organizations that haven’t been regularly contacted, listening to their needs, and providing meaningful support.
As far as 2026 in Texas is concerned, let’s hope for the best.