
Who’s ready for another insane November election?
A good chunk of my Substack centers on how the Democratic Party should devise a more effective and efficient organizing strategy. After analyzing data for the November 2025 constitutional amendment election, I introduced my two-pronged organizing model: short-term campaigning in high-turnout blue communities, and long-term infrastructure-building in low-turnout but high-potential blue communities.
But which communities are these, exactly? And what does long-term organizing look like? These are the questions we’ll tackle today.
Before I do, though, I should note that the responsibility for the organizing strategy lies directly with the Democratic Party as a whole, not with precinct chairs. Precinct chairs are volunteer foot soldiers, and they mostly carry out their leaders’ directives. Each precinct chair, no matter their neighborhood, should inform neighbors about the next election and the party’s values.
The organizing strategy, however, is today’s subject. For the most accurate readings, I am using data from the last major election: the November 2024 presidential election. Even though precincts have been redrawn and precinct chairs have changed over the last two years, the insights have largely remained intact.
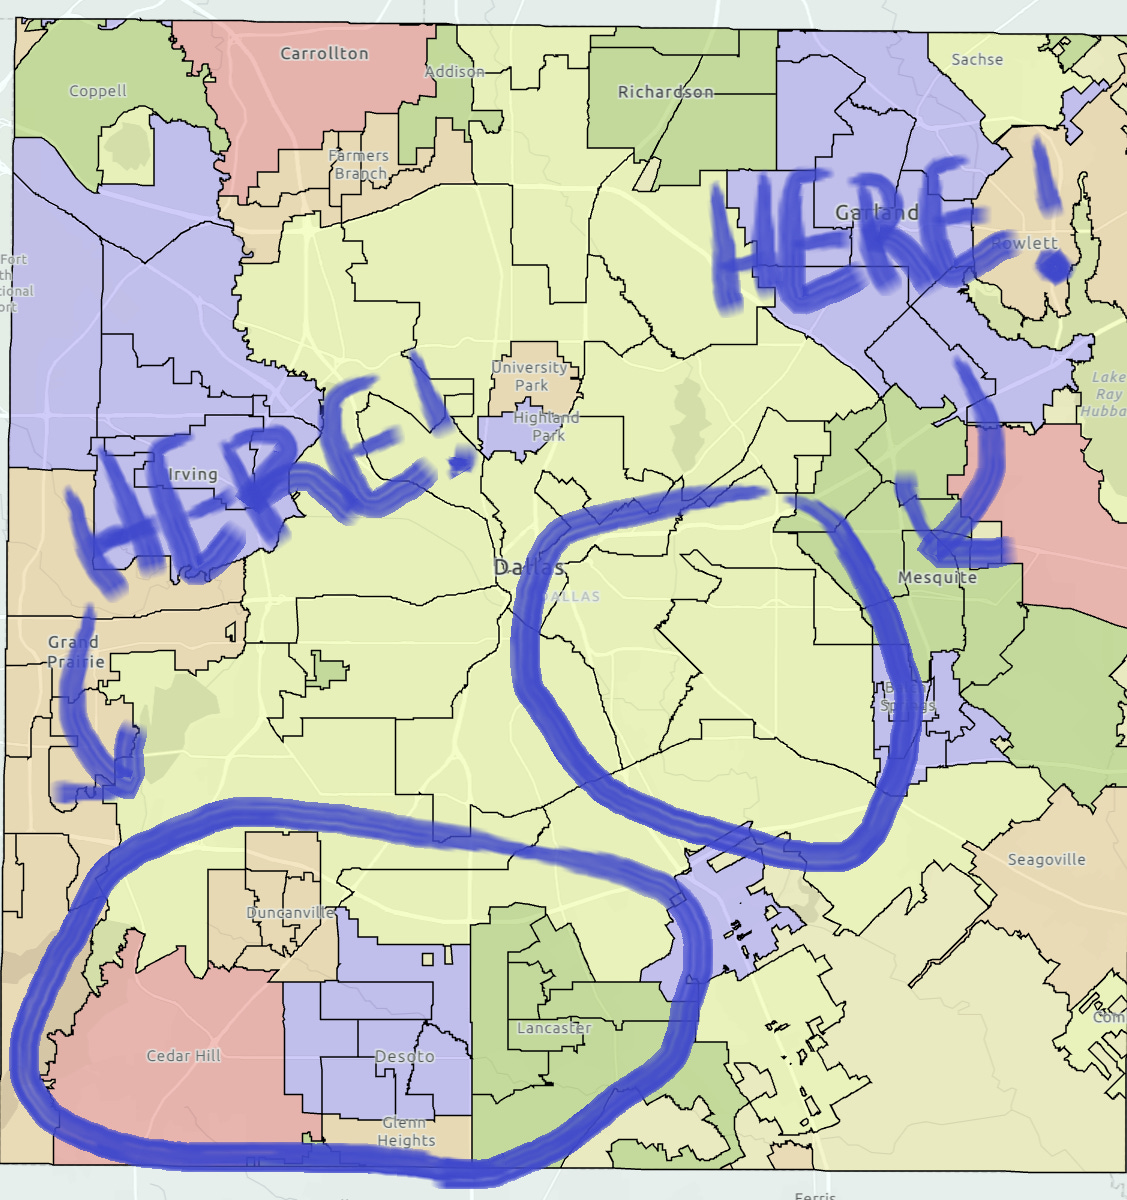
And instead of the usual TLDR that accompanies a data-heavy post like this, I opted to grab a screenshot of Dallas County and draw circles around the communities where we need to divert resources. This is one of my densest posts, and a TLDR honestly wouldn’t be much less dense.
But we can’t leave without the AI explainer video!
Filled precincts vs. unfilled precincts
Let’s begin by examining which areas had the highest rate of Democratic precinct chairs. A filled precinct has a precinct chair, while an unfilled precinct lacks one. I am also only accounting for “actual” precincts, defined as those with more than 50 registered voters.
In November 2024, the top five communities with filled precincts were:
DeSoto: 95.65%
Cedar Hill: 92.31%
Richardson: 86.36%
The Hills: 84.62%
Park Cities: 75.00%
And the bottom five:
Sachse: 20.00%
Rowlett: 16.67%
Addison: 0.00%
Balch Springs: 0.00%
Sunnyvale: 0.00%
As we see, communities with the most filled precincts fit into one or both of these categories:
They lean blue
They are middle- to upper-middle-income
Conversely, communities with unfilled precincts largely fall into one or both of these categories:
They lean red
They are lower- to lower-middle-income communities
The exception to the second rule is Addison, a blue community with zero precinct chairs in November 2024. That has changed, and Addison added two precinct chairs as of May 2026.
A notable community is The Hills, which consists of Highland Hills and Singing Hills. This mainly lower-middle-income community stands alongside four middle- to upper-middle-income communities. Let’s put a pin in The Hills as we continue.
Democratic representation
Another metric I use is how much an area is represented by elected Democratic leaders, by counting the number of precincts covered by Democratic elected officials. I consider these offices when calculating that:
County Commissioner
State Representative
State Senator
Congress Member
I do not count a community’s city council member, as that position is officially nonpartisan.
As of November 2024, 16 communities were 100% represented by Democrats:
Cedar Hill
DeSoto
Duncanville
East Oak Cliff
Kiest Park
Lancaster & Glenn Heights
South Dallas
Southwest Dallas
The Hills
Balch Springs
Buckner Terrace
Piedmont
Pleasant Grove
Far East Dallas
North & West Oak Cliff
West Dallas
The bottom five communities represented by Democrats are:
Coppell: 51.79%
Rowlett: 29.17%
Park Cities: 26.92%
Sachse: 25.00%
Sunnyvale: 25.00%
As expected, most of the communities most represented by Democrats are ones in Southern Dallas County.
Overall turnout in the election
Let’s turn our attention to turnout rates in the November 2024 election.
Here are the top five communities that turned out their registered voters:
Park Cities: 77.60%
Sunnyvale: 76.55%
Coppell: 71.07%
Preston Hollow: 70.29%
Northeast Dallas: 67.95%
And the bottom five:
Piedmont: 42.05%
Pleasant Grove: 41.28%
Kleberg-Rylie: 41.14%
East Oak Cliff: 41.07%
South Dallas: 39.18%
A throughline of this Substack is how much communities with money have more time to think about voting. We see this bear out here. Middle- to upper-income communities typically vote at higher rates than others.
Harris vs. Trump
Which areas made their voices heard in the race for president?
Here are the top five communities that voted for Kamala Harris:
The Hills: 90.04%
East Oak Cliff: 86.48%
South Dallas: 84.65%
DeSoto: 84.59%
Lancaster & Glenn Heights: 83.44%
And the bottom five:
Coppell: 50.51%
Rowlett: 45.86%
Sachse: 40.43%
Park Cities: 32.64%
Sunnyvale: 32.52%
Predictably, communities in the South voted for her at much higher rates than communities elsewhere.
Allred vs. Cruz
The final metric to consider is how much voters turned out for U.S. Senate candidate Colin Allred.
Here are the top five communities that did so:
The Hills: 92.68%
East Oak Cliff: 89.94%
South Dallas Area: 88.31%
DeSoto: 86.62%
Lancaster & Glenn Heights: 85.95%
And the bottom five:
Coppell: 53.52%
Rowlett: 49.32%
Sachse: 43.98%
Sunnyvale: 35.93%
Park Cities: 34.67%
Essentially, the outcome for the Senate race virtually mirrors that of the presidential race.
So, taking into consideration overall voter turnout, the share for Harris, and the share for Allred, we have a region — Southern Dallas County — that votes solidly blue, but doesn’t turn out enough of its voters. Northern Dallas County, on the other hand, turns out the most voters, but votes much more Republican. Let’s remember that.
Which areas are the most engaged for Democrats?
Now let’s see which areas were the most friendly to Democrats. I calculated the Democratic Engagement score by factoring the aforementioned four components:
Filled precincts
Overall turnout
Share for Harris
Share for Allred
This proprietary scale ranges from 0.00 to 1.00.
In November 2024, the top five communities for Democratic engagement were:
DeSoto: 0.83
The Hills: 0.78
Cedar Hill: 0.76
Buckner Terrace: 0.69
East Oak Cliff: 0.69
And the bottom five:
Addison: 0.45
Balch Springs: 0.45
Rowlett: 0.45
Sachse: 0.43
Sunnyvale: 0.36
DeSoto is the Dallas County community that most proudly supports the Democratic Party. If you read my election breakdowns after every cycle, you are probably not shocked at this result.
And once again, unsurprisingly, Southern and/or predominantly black and Hispanic communities showed the highest engagement. The least Democratically engaged communities were either conservative or lacked precinct chairs.
Which areas contain the most opportunity for Democrats?
While engagement tells us what we have, opportunity tells us what’s missing. Where do Democrats have the most ground to gain? I created the Democratic Opportunity score based on five factors:
Filled precincts
Democratic representation
Overall turnout
Share for Harris
Share for Allred
This scale also ranges from 0.00 to 1.00.
Here are the top five communities that carry the most opportunity for our party:
Balch Springs: 0.78
South Dallas: 0.77
East Oak Cliff: 0.76
Pleasant Grove: 0.76
Kleberg-Rylie: 0.73
And the bottom five:
Richardson: 0.46
Coppell: 0.45
Sachse: 0.44
Sunnyvale: 0.43
Park Cities: 0.28
And what do we see? Communities displaying the most opportunity have a high representation of Democratic officials but low voter turnout. Balch Springs, with zero precinct chairs in November 2024, is the most stark example.
Communities with the lowest opportunity, however, have mostly Republican officials or are, as is the case of Richardson, nearly tapped out regarding their contributions to the Democratic Party.
Which areas would be the best overall for Democrats?
Finally, what if we imagine a future where we combine engagement and opportunity? What if we added a community’s existing excitement for the Democratic Party to our undying efforts to bolster that community’s involvement? That is where I formed the Democratic Full Potential score.
This scale ranges from 0.00 to 2.00.
Here are the top five communities with the fullest potential:
The Hills: 1.49
DeSoto: 1.45
East Oak Cliff: 1.44
South Dallas: 1.42
Lancaster & Glenn Heights: 1.41
And the bottom five:
Coppell: 1.04
Rowlett: 0.93
Sachse: 0.87
Park Cities: 0.83
Sunnyvale: 0.80
Remember when I told you to put a pin in The Hills? This is why. This community has the greatest potential to be the top Democratic stronghold in Dallas County. DeSoto, East Oak Cliff, South Dallas, and Lancaster follow closely.
The bottom five are, expectedly, all conservative.
Which communities need which organizing approach?
Now that we know which communities need resources, let’s decide who gets what.
To begin, we’ll take the end result — the Democratic Full Potential score — and determine which prong goes to which community.
The list again for Democratic Full Potential:
The Hills: 1.49
DeSoto: 1.45
East Oak Cliff: 1.44
South Dallas: 1.42
Lancaster & Glenn Heights: 1.41
Next, let’s grab the overall turnout in the November 2024 election in Dallas County. That number is 58.41%.
And for the above five communities, here are their individual turnout numbers:
The Hills: 45.50%
DeSoto: 64.42%
East Oak Cliff: 41.07%
South Dallas: 39.18%
Lancaster & Glenn Heights: 57.71%
If a community scores higher than the county turnout, it needs to direct its energy more toward short-term GOTV efforts for electoral campaigns, since its voters display more political awareness than average. If a community scores lower, we need to focus more on long-term infrastructure.
Here is the chart depicting which communities fall above and below the benchmark of county turnout.
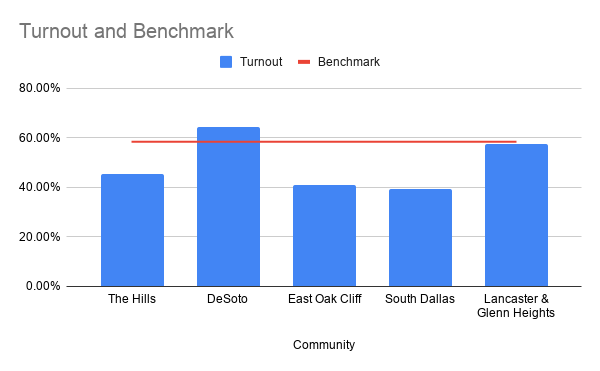
Judging by these numbers, DeSoto is the only one of the top five truly ready to concentrate almost solely on short-term GOTV efforts. Lancaster comes close, while the other three need to zero in on long-term building.
If we feel a little dismayed that we don’t have more potentially great Democratic communities requiring less infrastructure, we can examine the next five on our Democratic Full Potential list. Maybe we’ll strike it lucky there.
Here they are and their turnout numbers:
Southwest Dallas: 51.73%
Buckner Terrace: 51.34%
Kiest Park: 50.57%
Cedar Hill: 63.52%
West Dallas: 47.06%
Now let’s compare these five with the county benchmark:
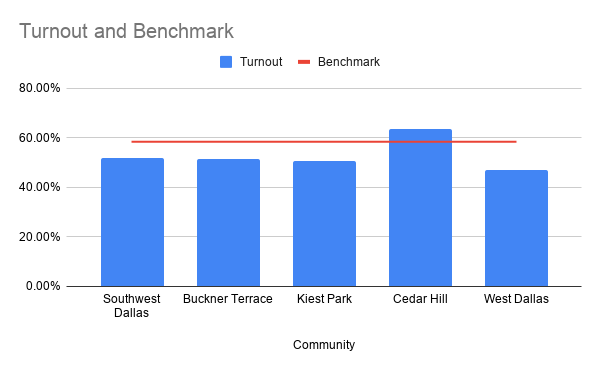
For this set, Cedar Hill is the only community not requiring significant long-term investment. The rest fall well short of the baseline.
What does this tell us? Most of Dallas County’s organizing must focus on developing long-term infrastructure.
I stated it last year after crunching the numbers for November 2025: In urban counties like Dallas, the Democratic Party must focus on communities of color, especially disadvantaged communities.
The Hills, East Oak Cliff, South Dallas, Southwest Dallas, Buckner Terrace, Kiest Park, and West Dallas are all predominantly black and Hispanic communities experiencing some level of economic hardship. These are 7 of the top 10 communities that show the potential to be among the highest-yielding Democratic bastions, possibly in all of Texas. If we continue to show a lack of interest and intentionality here, we will never realize our full potential as a party.
Instead, what do we see? We witness armies of volunteers carrying out short-term GOTV efforts in communities begging for meaningful, long-term investment. That is the fundamental organizing mismatch between what we need to do and what the Democratic Party does.
For months leading up to any election, hardworking volunteers hand out Democratic literature to inconsistent voters in working-class communities who, for the most part, don’t end up voting anyway. The input does not match the output. And that is because, as I keep explaining throughout my Substack, we must first address people’s basic necessities.
What long-term community investment really is
This is going to sound a bit sacrilegious: To build long-term Democratic infrastructure, don’t talk about Democrats.
The definition of insanity, according to one famous scientist who never actually said it, is doing the same thing over and over and expecting different results. In Democratic politics, it’s knocking on doors and getting yelled at by inconsistent voters while still hoping they vote blue.
This method doesn’t prove successful because, frankly, most Americans don’t care about politics. Not only do they not care, many working-class people genuinely have no idea who’s running. It’s less an issue of broader civic engagement and more a phenomenon of cognitive overload.
Most people struggling to pay rent, put food on the table, fill up their cars, pay medical bills, or breathe clean air fixate almost entirely on those things. Any leftover bandwidth is reserved for escaping into music, TV, or sports. A bright and smiling Democratic volunteer at their door, no matter how friendly, is the last thing on their mind. So when we say long-term infrastructure, we mean approaching the real and deep problems faced by working-class voters in a much more holistic manner.
How does that look on the ground? While each community has its own needs — Joppa and West Dallas with polluting factories, for example, or Sand Branch with no running water (more on that in a later post) — commonalities exist across all working-class communities. One big and low-hanging fruit, as I illustrated in my last post, is organizing renters.
But regardless of the issue, the template remains the same:
Partner: The party partners with organizations already doing the heavy lifting of organizing around these issues
Register: The party helps register voters in these communities
Listen: The party actively listens to people’s concerns without asking for anything
Does that seem like a long process? Yes, and that’s the point of long-term community investment. We need to consistently demonstrate that we hear and see people where they are before we gently make any sort of pitch.
And maybe then, the Democratic Party becomes the juggernaut in Texas we know it can be.